Star Schema vs Snowflake Schema: Data Modeling Made Simple
Once your data is clean, how do you arrange it for analysis? Meet the two classic layouts — with real tables, real SQL, and a clear rule for which to pick.
An analyst opens a dashboard. It spins. And spins. Four minutes later, the numbers finally load. Everyone blames “the database” — but the real culprit is something quieter: how the tables were arranged. Get that arrangement right and the same dashboard loads in two seconds.
That arrangement is called data modeling, and the two classic layouts are the star schema and the snowflake schema. They sound academic. They’re not — by the end of this you’ll sketch both from memory, using our grocery company’s sales as the running example.
First: facts and dimensions
Both schemas are built from just two kinds of tables. Nail this one distinction and the rest is easy.
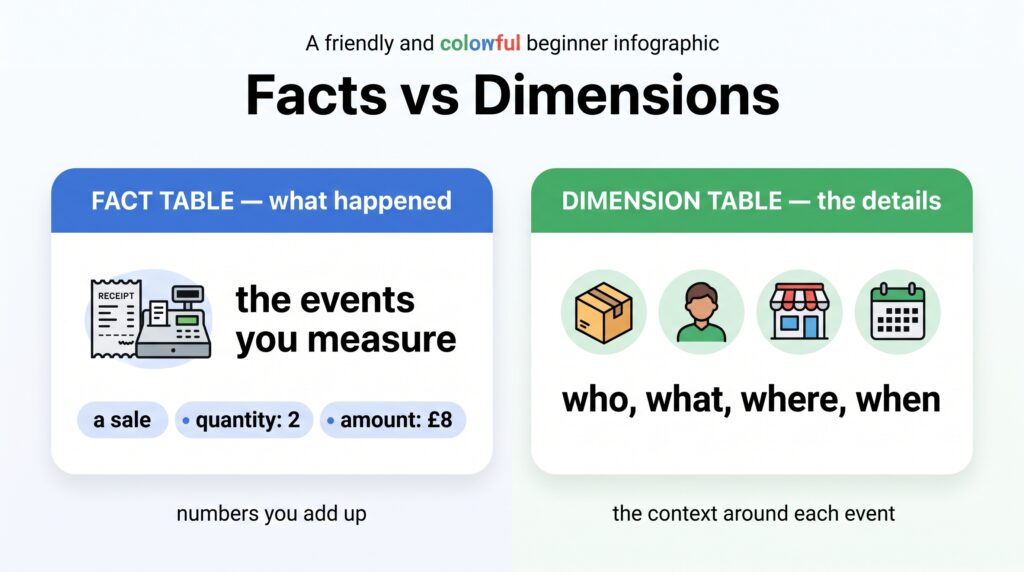
Fact table — the events you measure. Each row is one thing that happened: a sale. It holds numbers you add up (quantity, amount) plus links to the who/what/where/when.
Dimension table — the context around those events. The who/what/where/when itself: product details, customer details, store location, calendar date.
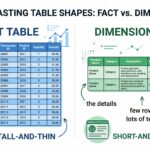
Fact tables record what happened; dimension tables describe the who, what, where, and when.
Plain version: the fact table says a sale of 2 units for £8 happened, and dimension tables explain which product, which customer, which store, which day. That’s the whole idea.
The star schema — one fact, dimensions around it
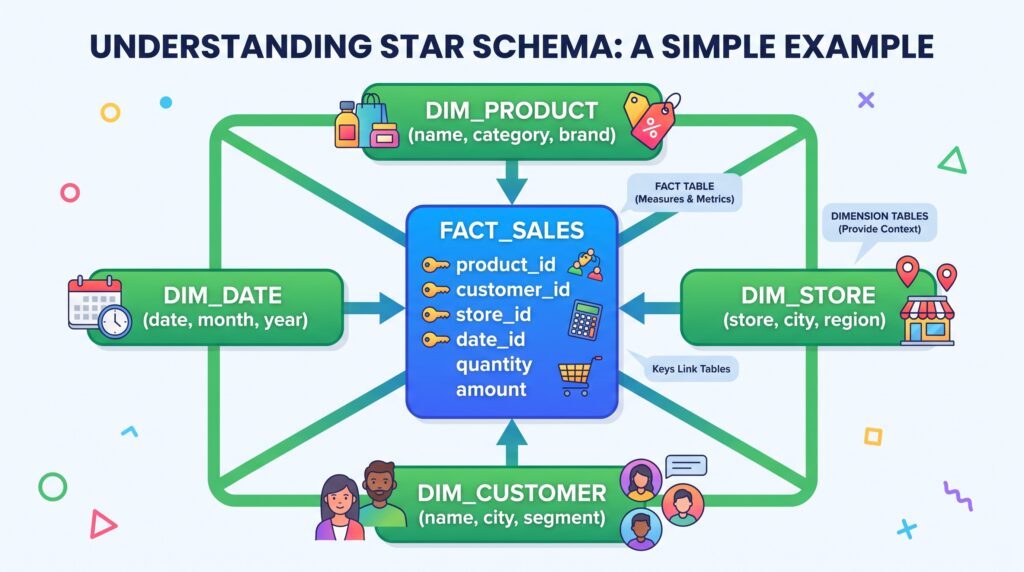
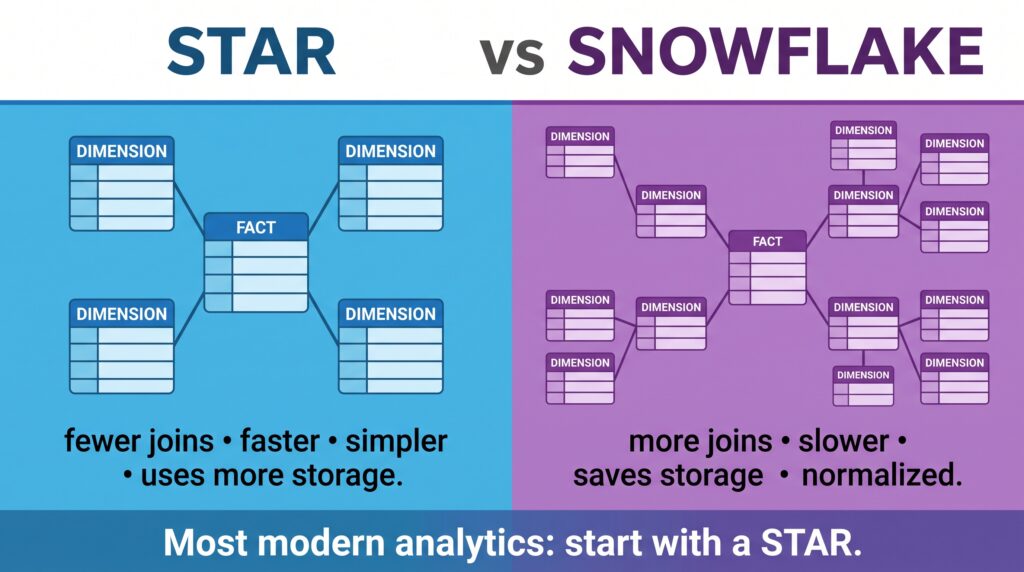
A star schema puts the fact table in the middle, with dimension tables around it — each just one hop away. Diagram it and it looks like a star.
A star schema: the fact table at the center, dimensions radiating out one hop away.
In SQL, that’s a fact table full of ID links and small dimension tables holding the descriptions:
-- The fact: one row per saleCREATETABLEfact_sales ( sale_id INT, date_id INT, -- link to dim_date product_id INT, -- link to dim_product customer_id INT, -- link to dim_customer store_id INT, -- link to dim_store quantity INT, -- measure you can sum amount DECIMAL-- measure you can sum);-- A dimension: the details of each productCREATETABLEdim_product ( product_id INTPRIMARY KEY, product_name VARCHAR, category VARCHAR, -- e.g. "Dairy" brand VARCHAR);
Now the payoff — answering “revenue by category” is a single, readable SQL join:
SELECTp.category,SUM(f.amount) AS revenueFROM fact_sales fJOIN dim_product p ONf.product_id=p.product_idGROUP BYp.categoryORDER BY revenue DESC;
One join, one hop, done. That simplicity is the entire point of the star schema.
Fast — few joins, so queries fly
Simple — easy for analysts to understand and write
Trade-off — dimensions repeat data (every Dairy product stores the text “Dairy”)
The snowflake schema — dimensions split into more tables
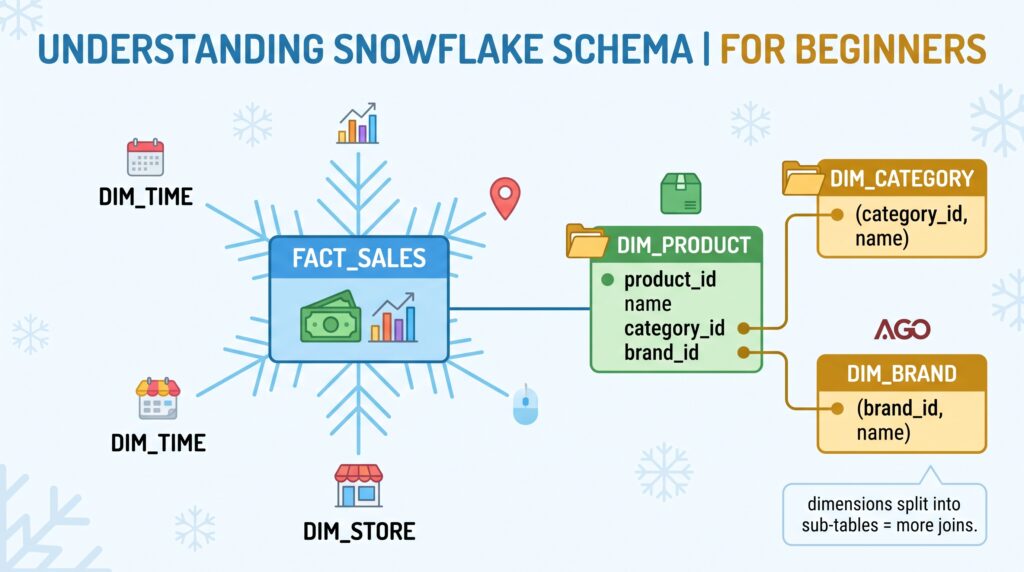
A snowflake schema takes those dimensions and normalizes them — splitting repeated details into their own sub-tables. Instead of storing “Dairy” on every product row, you store a category_id that points to a separate dim_category table.
A snowflake schema: dimensions branch into sub-tables, forming a snowflake shape.
In SQL, one dimension becomes several:
-- STAR: everything about a product in one tabledim_product(product_id, product_name, category, brand)-- SNOWFLAKE: category and brand split into their own tablesdim_product (product_id, product_name, category_id, brand_id)dim_category(category_id, category_name)dim_brand (brand_id, brand_name)
Now the same “revenue by category” question needs an extra join to reach the category name:
SELECTc.category_name,SUM(f.amount) AS revenueFROM fact_sales fJOIN dim_product p ONf.product_id=p.product_idJOIN dim_category c ONp.category_id=c.category_id-- the extra hopGROUP BYc.category_nameORDER BY revenue DESC;
Saves space — “Dairy” is stored once, not on every product row
Cleaner updates — rename a category in one place
Trade-off — more joins, so queries are slower and harder to write
Star vs snowflake, side by side
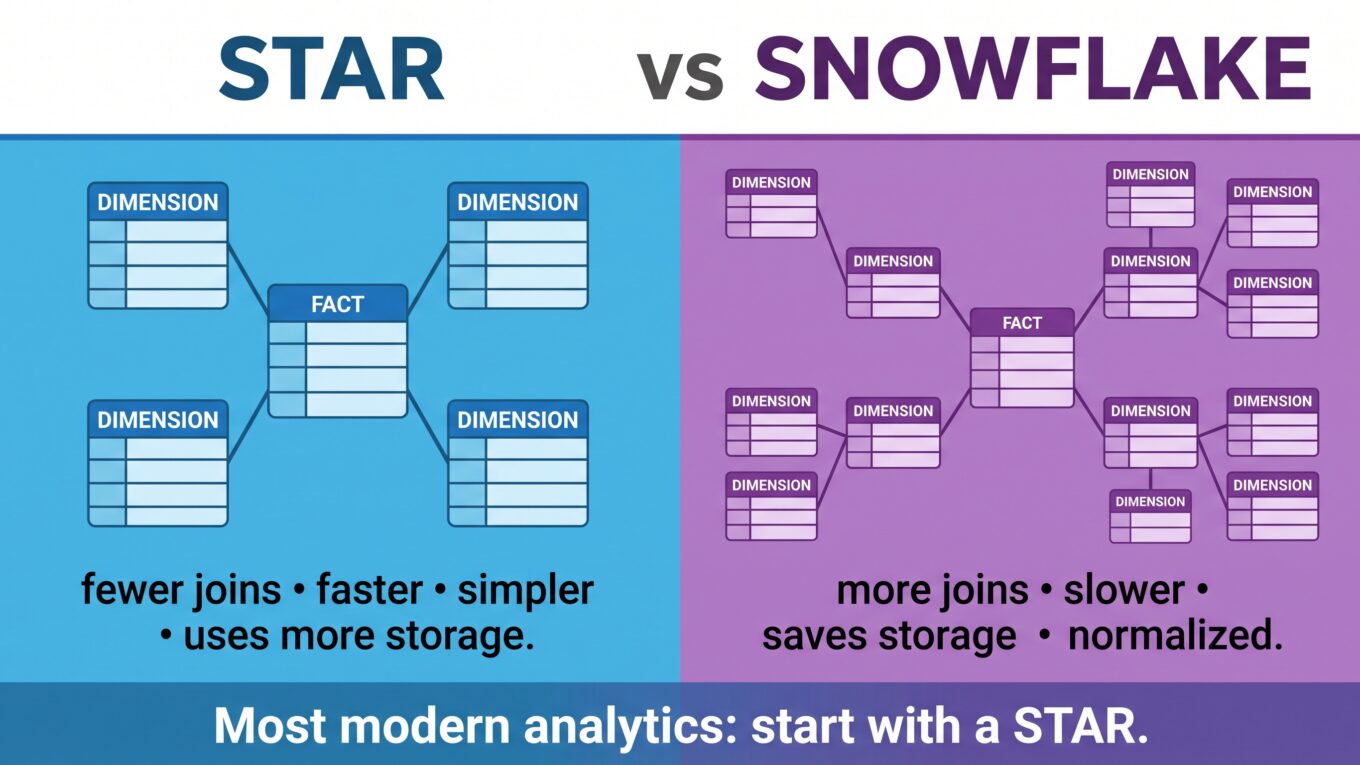
Star vs snowflake at a glance — simplicity and speed versus normalized, space-saving structure.
Star schema
Snowflake schema
Dimensions
One table each
Split into sub-tables
Joins to query
Fewer
More
Query speed
Faster
Slower
Ease for analysts
Easier
Harder
Storage used
More (repeats data)
Less (normalized)
Data updates
Repeated in places
Change once
Shape
Simple star
Branching snowflake
So which should you use?
For most analytics work, the honest answer is: use a star schema.
Rule of thumb: Start with a star. Its speed and simplicity beat the storage savings of a snowflake almost every time — and modern cloud storage is cheap, so the main reason to snowflake barely matters anymore.
Reach for snowflaking only when a dimension is genuinely huge and repetitive, or when the business truly needs the tighter, normalized structure. In practice, most warehouses today lean heavily toward star schemas precisely because analysts value fast, simple queries — and storage is no longer the bottleneck it was when snowflaking was invented.
The takeaway
Star and snowflake schemas are two ways to arrange fact and dimension tables. A star keeps each dimension in a single table around a central fact — fewer joins, faster and simpler queries, at the cost of some repeated data. A snowflake splits dimensions into sub-tables — saving space and tidying updates, but adding joins and complexity. For most modern analytics, start with a star and only snowflake when you have a specific reason. Cheap storage has made simplicity the winning trade.
We leaned on fact and dimension tables here without fully unpacking them. Next, we’ll do exactly that — a proper look at fact and dimension tables, the two building blocks every data model is made of.
Frequently Asked Questions
What is the difference between a star schema and a snowflake schema?
A star schema keeps each dimension in a single table directly around the fact table, so queries need fewer joins and run faster. A snowflake schema splits dimensions into normalized sub-tables, which saves storage and tidies updates but requires more joins and makes queries slower and more complex.
What are fact and dimension tables?
A fact table stores the events you measure — like sales — with numeric values such as quantity and amount, plus links to dimensions. Dimension tables store the descriptive context around those events, such as product details, customer details, store location, and date. Both star and snowflake schemas are built from these two table types.
Which is better, star or snowflake schema?
For most analytics, a star schema is better because it is faster and simpler to query, and modern cloud storage is cheap enough that the snowflake’s main advantage — saving space — rarely matters. Use a snowflake schema only when a dimension is very large and repetitive or when normalized structure is genuinely required.
Why is it called a star schema?
It’s called a star schema because when you diagram it, the central fact table sits in the middle with dimension tables radiating outward around it, forming a shape that looks like a star. The snowflake schema gets its name because its normalized, branching dimensions resemble a snowflake.
Does a star schema use more storage than a snowflake schema?
Yes. A star schema repeats descriptive values inside each dimension table — for example storing a category name on every product row — which uses more space. A snowflake schema normalizes those details into separate tables so each value is stored once, using less storage at the cost of extra joins.