Fact and Dimension Tables: The Two Building Blocks of Every Data Model
Get these two tables right and your whole warehouse makes sense. Get them wrong and nothing adds up. A beginner's guide with real data and the one question that matters: the grain.
A new engineer builds their first warehouse table. They cram everything into one giant table — every sale, plus the product name, the customer’s full address, the store manager’s phone number, repeated on every single row. It works for a week. Then it balloons to billions of rows, queries crawl, and updating one customer’s address means rewriting a million rows.
The fix is one of the oldest, most reliable ideas in data: split everything into fact tables and dimension tables. We touched these in the star schema article — now let’s really understand them, because they’re the two building blocks every data model is made of.
Two tables, two totally different jobs
The whole idea comes down to separating what happened from the details about it.
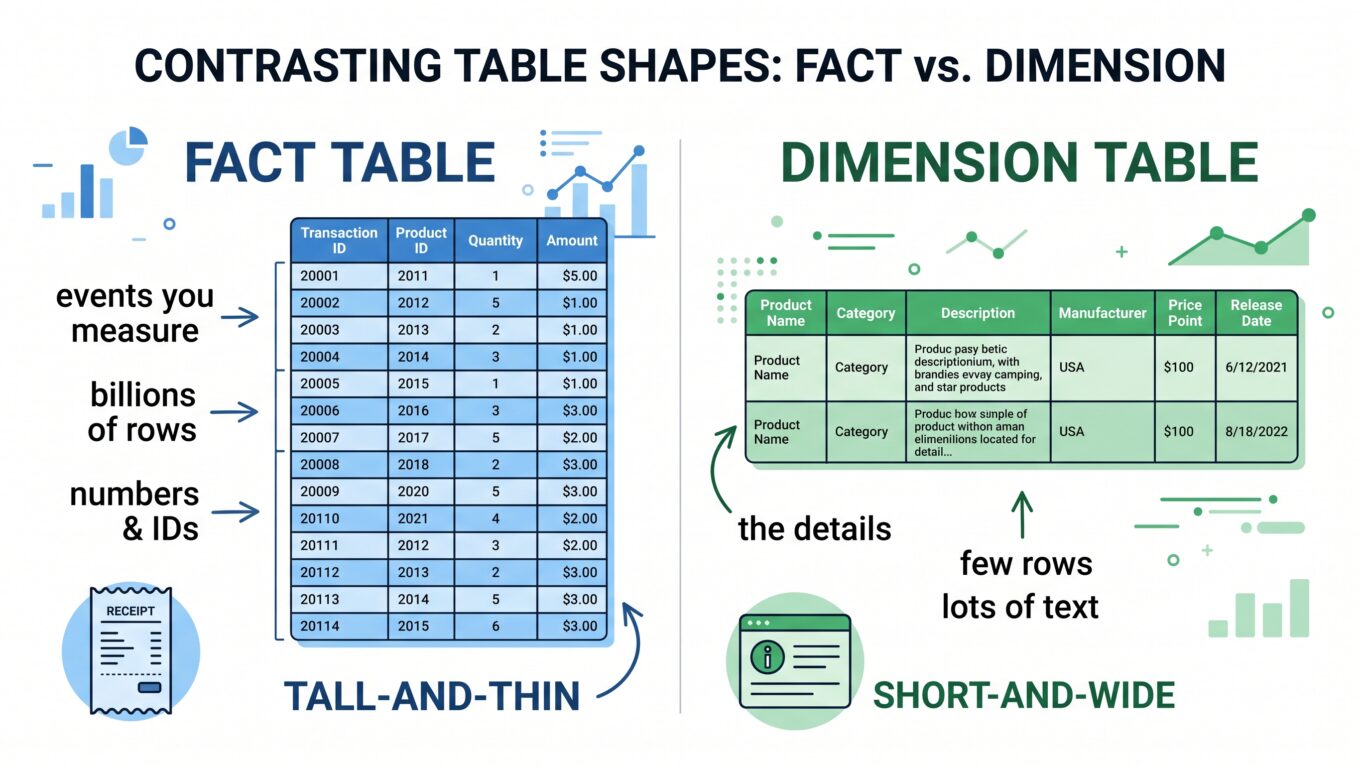
Fact table — records events. Tall and thin: billions of rows, few columns. Mostly numbers and ID links.
Dimension table — describes things. Short and wide: few rows, many columns. Mostly text and details.
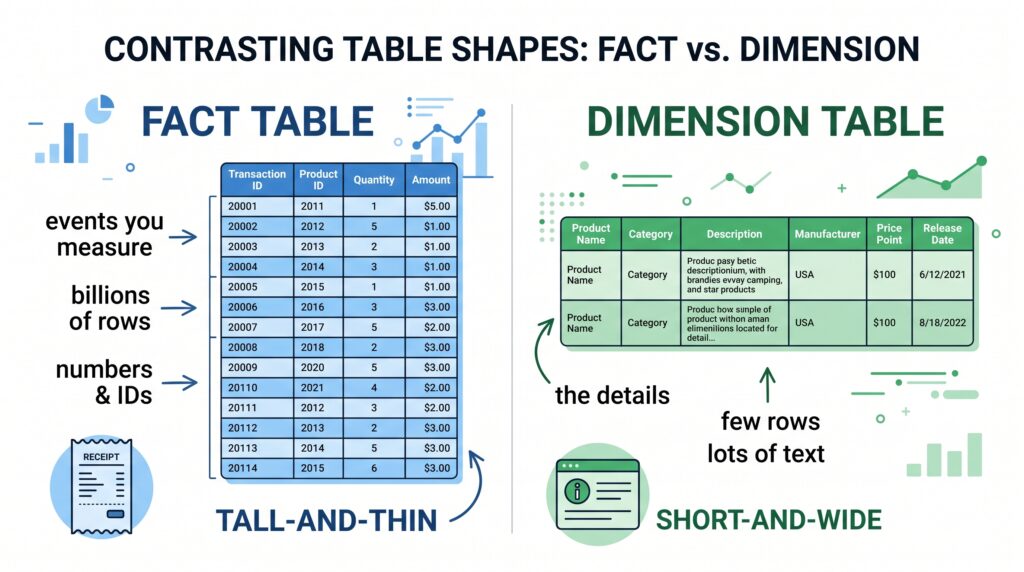
Fact tables are tall and thin (many events, few columns); dimension tables are short and wide (few items, rich detail).
That shape difference isn’t a coincidence — it’s the whole point. Events happen constantly (millions of sales), so the fact table grows forever. But there are only so many products or stores, so dimension tables stay small. Keeping them apart means you store each product’s details once, not on every sale.
The fact table — what happened
A fact table holds the events you measure. In our grocery company, that’s fact_sales — one row every time something sells. It contains two kinds of columns:
Measures — the numbers you analyze: quantity, amount. These are what you sum, average, and count.
Foreign keys — the ID links to dimensions: product_id, customer_id, store_id, date_id. These tell you the context.
Notice: almost no words, just numbers and IDs. That’s a healthy fact table — skinny, so even billions of rows stay fast to scan and cheap to store.
The grain — the one question you must answer first
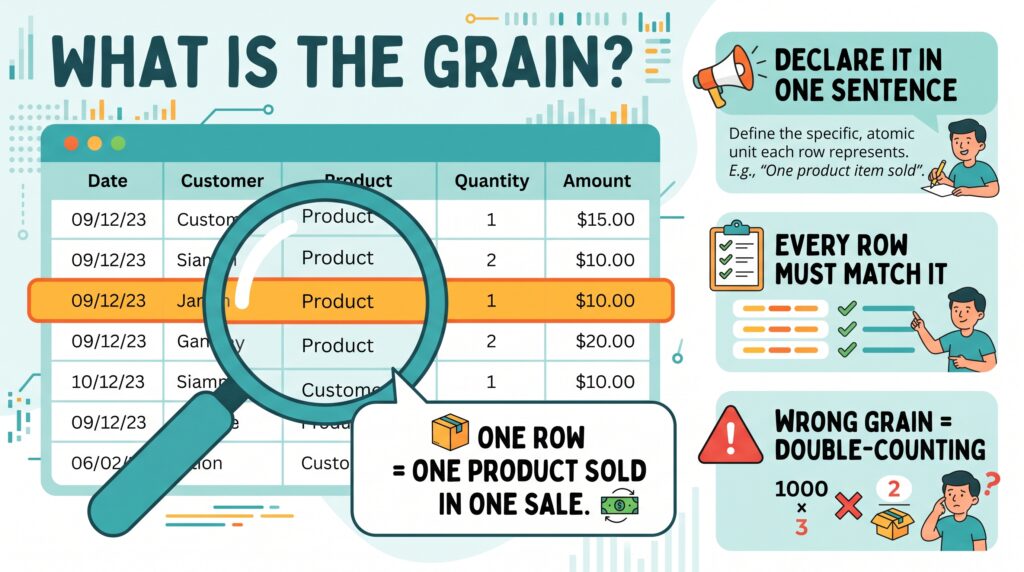
Before building any fact table, answer one question: what does a single row represent? That’s called the grain, and getting it wrong quietly corrupts everything downstream.
The grain is the meaning of a single row — pin it down before you build anything.
For fact_sales, the grain might be “one row per product per sale.” State it in a plain sentence and stick to it. If some rows are per-sale and others are per-product, your totals will silently double-count — the kind of bug that shows up in an executive meeting, not in your tests.
Golden rule: Declare the grain in one sentence before you write a single line of SQL. Every row in the table must match it — no exceptions.
The dimension table — the details
A dimension table holds the descriptive context — the who, what, where, when. It’s where all the text lives: names, categories, cities, labels. Each dimension has a key that the fact table links to.
Dimensions are how you slice your data. Every time a business question says the word “by” — revenue by category, sales by city, orders by month — that “by” is a dimension. Facts give you the numbers; dimensions give you the ways to group them.
How they click together
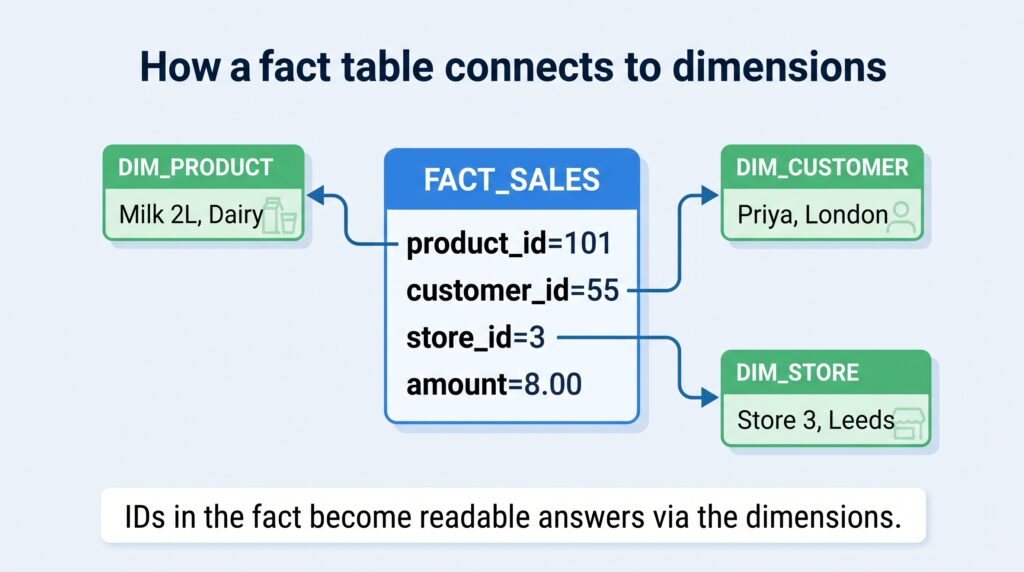
The magic is the join. A skinny fact row carries only IDs; the dimensions turn those IDs into human-readable answers.
A fact row’s IDs link out to dimension rows, turning raw numbers into readable answers.
Ask “revenue by category,” and SQL joins the fact to the product dimension to translate product_id = 101 into “Dairy”:
SELECTp.category,SUM(f.amount) AS revenue -- measure from the FACTFROM fact_sales fJOIN dim_product p ONf.product_id=p.product_id-- context from the DIMENSIONGROUP BYp.categoryORDER BY revenue DESC;
Measures come from the fact; the grouping (category) comes from the dimension. That clean division is why the model scales so well.
Fact vs dimension, side by side
Fact table
Dimension table
Holds
Events / measurements
Descriptive context
Example
A sale
A product, a customer
Main columns
Numbers & foreign keys
Text & attributes
Shape
Tall & thin
Short & wide
Row count
Huge (billions)
Small (thousands)
Answers
“how much / how many”
“by what / who / where / when”
Grows
Constantly
Slowly
Beginner mistakes to avoid
Putting text in the fact table. Storing the full product name on every sale bloats the table. Store the product_id and keep the name in the dimension.
An unclear grain. If you can’t say in one sentence what a row means, stop and define it. Mixed grains cause double-counting.
Numbers that shouldn’t be summed. A customer_id is a number, but summing it is meaningless. Real measures are things like amount and quantity — values that make sense to add up.
The takeaway
Fact and dimension tables split your data into two clean halves: facts record what happened (tall, thin, full of numbers and IDs), and dimensions describe the context (short, wide, full of text). The single most important step is declaring the grain — what one fact row means — before you build. Get that right, keep text in dimensions and measures in facts, and your warehouse stays fast, cheap, and correct no matter how big it grows. This is the backbone of every star and snowflake schema you’ll ever build.
There’s one tricky question we’ve dodged: what happens when a dimension changes — a customer moves city, a product changes category? Answering that correctly is its own art, called Slowly Changing Dimensions, and it’s what we’ll tackle next.
Frequently Asked Questions
What is the difference between a fact table and a dimension table?
A fact table stores events you measure, such as sales, with numeric values (measures) and ID links (foreign keys) to dimensions. A dimension table stores descriptive context, such as product or customer details, mostly as text. Fact tables are tall and thin with many rows; dimension tables are short and wide with rich detail.
What is the grain of a fact table?
The grain is what a single row in the fact table represents — for example, “one row per product per sale.” Declaring the grain in one clear sentence before building is essential, because rows that don’t match the stated grain cause double-counting and incorrect totals.
What are measures in a fact table?
Measures are the numeric values you analyze in a fact table, such as quantity and amount. They are the numbers you sum, average, or count. Values like IDs are also numbers but are not measures, because adding them up has no business meaning.
Why separate facts and dimensions instead of one big table?
Separating them avoids repeating descriptive text on every event row, which keeps the huge fact table small and fast and lets you update a detail (like a customer’s city) in one place. One giant table repeats data, grows unnecessarily, and becomes slow and painful to maintain.
Can a data model have more than one fact table?
Yes. Large warehouses have many fact tables — for example separate facts for sales, inventory, and website clicks — often sharing the same dimension tables like product and date. Reusing dimensions across facts is a normal and powerful part of dimensional modeling.