If you’ve followed this series, you’ve quietly been learning about data pipelines the whole time. Moving data from OLTP to OLAP? A pipeline. ETL and ELT? Two shapes of a pipeline. It’s the single idea underneath almost everything a data engineer builds.
So let’s define it properly, take it apart, and see the pieces every pipeline shares — because once you can picture the anatomy, the whole job starts to make sense.
What is a data pipeline?
A data pipeline is an automated system that moves data from where it’s created to where it’s needed — cleaning and reshaping it along the way — without a human doing it by hand.
The key word is automated. Anyone can copy a spreadsheet once. A pipeline is what makes that same move happen every single day, reliably, at 3 AM, without anyone touching it.
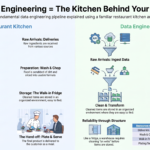
Think of a bottling factory. Empty bottles go in one end. Along a conveyor belt, each one is cleaned, filled, capped, labeled, and boxed — every station doing one job, automatically, thousands of times an hour. Nobody fills each bottle by hand. A data pipeline is that conveyor belt, but the thing moving along it is data.
Why do pipelines exist? The problem they solve
Imagine doing it the manual way. Every morning, someone logs into five systems, exports five files, cleans them in a spreadsheet, merges them, and emails the result. It works — until it doesn’t:
- The person is on holiday, and the report simply doesn’t happen.
- They make a copy-paste mistake, and nobody notices for a week.
- The data grows too big for a spreadsheet.
- The business now wants it hourly, not daily — impossible by hand.
A pipeline removes the human from the repetitive loop. Build it once, and it runs forever — consistently, at any scale, on any schedule. That’s the whole point: automate the boring, repeatable movement of data so people can do the thinking instead.
The anatomy of a data pipeline
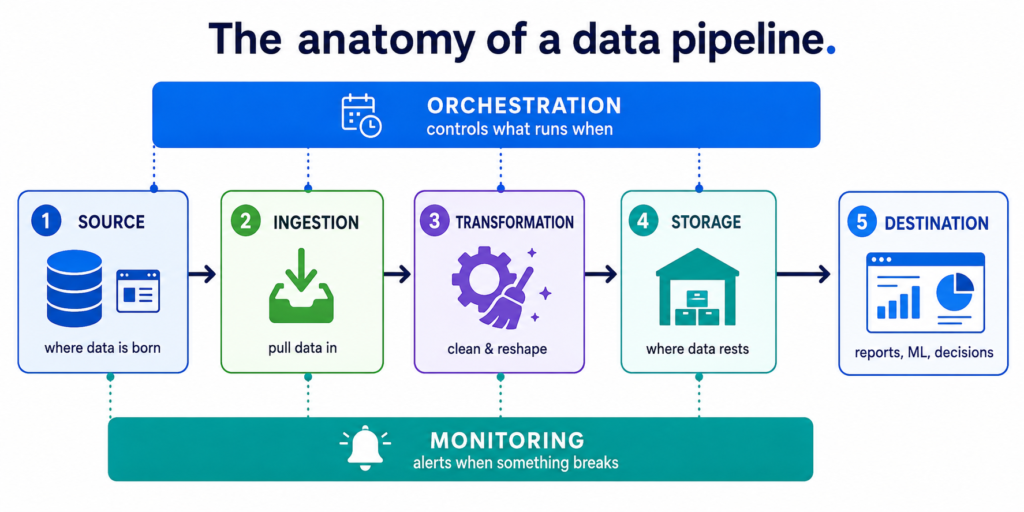
Almost every pipeline, no matter how fancy, is built from the same handful of parts. Learn these six and you can read any architecture diagram.
1. Source — where data is born
The starting point: the app database, website events, a payment system, third-party APIs, uploaded files. The raw bottles arriving at the factory door.
2. Ingestion — pulling the data in
The step that grabs data from the source and brings it into your system. It can run on a schedule (every night at 2 AM) or continuously (the moment new data appears). This is the conveyor belt picking up each bottle.
3. Transformation — cleaning and reshaping
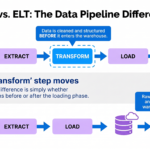
The heart of the work: fix errors, remove duplicates, combine sources, calculate new values. Washing, filling, and capping the bottle. Whether this happens before or after storage is exactly the ETL vs ELT distinction.
4. Storage — where data rests
The cleaned data lands somewhere it can be used — a warehouse, lake, or lakehouse. The boxed bottles going onto the shelf.
5. Orchestration — the conductor
Something has to decide what runs when, and in what order. Ingestion must finish before transformation starts; step 3 mustn’t run if step 2 failed. This traffic-controller is called orchestration — the factory floor manager making sure each station fires in the right sequence. Tools like Apache Airflow live here.
6. Monitoring — the alarm system
When something breaks — and it will — someone needs to know fast. Monitoring watches every step and raises an alert when a job fails, runs late, or produces weird numbers. The sensor that stops the line when a bottle jams, instead of letting 10,000 broken ones pile up.
A real example, end to end
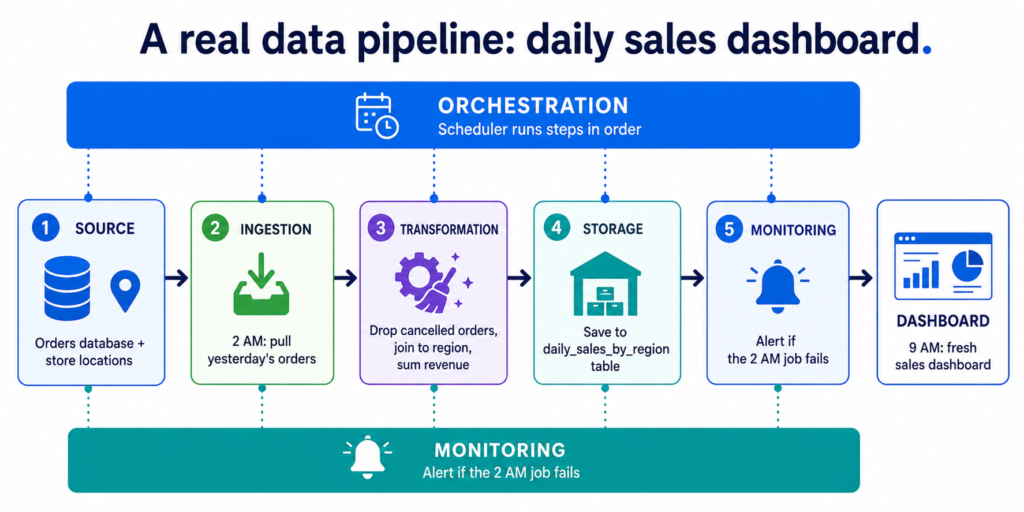
Back to the online grocery company from earlier in the series. The business wants a dashboard showing yesterday’s sales by region, fresh every morning. Here’s the pipeline behind it:
- Source: the orders database and the store-location table.
- Ingestion: at 2 AM, pull yesterday’s orders into the data platform.
- Transformation: remove cancelled orders, join each order to its region, sum revenue per region.
- Storage: write the result into a clean
daily_sales_by_regiontable in the warehouse. - Orchestration: a scheduler runs these steps in order, only starting each once the previous succeeds.
- Monitoring: if the 2 AM job fails, an alert fires so the engineer fixes it before anyone opens the dashboard at 9.
Every morning, the dashboard is just… correct. No human involved. That invisible reliability is a well-built pipeline doing its job.
What makes a pipeline good (not just working)
A pipeline that runs isn’t the same as a pipeline you can trust. The ones that survive in production share a few traits:
| Trait | What it means | Why it matters |
|---|---|---|
| Reliable | Runs the same way every time | People depend on the output daily |
| Re-runnable | Safe to run twice without doubling data | Failures happen; you need to retry cleanly |
| Monitored | Tells you when it breaks | Silent failures erode trust the fastest |
| Scalable | Handles more data without falling over | Data only grows |
| Documented | Others can understand it | You won’t be the only one maintaining it |
That second one — re-runnable (engineers call it idempotent) — trips up almost every beginner. If a pipeline fails halfway and you run it again, it should not create duplicate rows. Designing for clean retries is one of the real skills that separates a working pipeline from a professional one.
The takeaway
A data pipeline is simply an automated conveyor belt for data: it moves information from where it’s created to where it’s needed, cleaning it on the way, without a human in the loop. Every pipeline shares the same anatomy — source, ingestion, transformation, storage, orchestration, and monitoring — and building reliable, re-runnable, well-watched versions of these is the core craft of data engineering.
One big question decides how a pipeline is shaped: does the data move in big scheduled batches, or does it flow continuously in real time? That’s batch vs streaming — and it’s what we’ll tackle next.
Frequently Asked Questions
What is a data pipeline in simple terms?
A data pipeline is an automated system that moves data from where it is created to where it is needed, cleaning and reshaping it along the way, without a person doing it by hand. It’s like a factory conveyor belt, but the thing moving along it is data.
What are the main parts of a data pipeline?
Most pipelines share six parts: a source (where data comes from), ingestion (pulling data in), transformation (cleaning and reshaping), storage (where data lands), orchestration (controlling what runs when), and monitoring (alerting when something breaks).
Is a data pipeline the same as ETL?
ETL is a type of data pipeline. “Data pipeline” is the general term for any automated data movement, while ETL (Extract, Transform, Load) and ELT describe a specific order of steps within a pipeline. All ETL processes are pipelines, but not all pipelines follow the ETL pattern.
Why are data pipelines important?
They remove slow, error-prone manual work by automating how data moves and gets cleaned. This makes reports, dashboards, and AI models reliable, consistent, and available on schedule, even as data grows to a scale no human could handle by hand.
What tools are used to build data pipelines?
Common building blocks include SQL and Python for logic, an orchestration tool like Apache Airflow to control the order of steps, a cloud data warehouse or lakehouse for storage, and monitoring tools for alerts. The exact stack varies, but the roles stay the same across most pipelines.