Executor out of memory means one task was handed more data than its share of memory could hold. Here is how to tell it apart from driver OOM, what the two different errors mean, and the fixes in order.
Job aborted due to stage failure: Task 47in stage 12.0 failed 4 times,most recent failure: Lost task 47.3in stage 12.0java.lang.OutOfMemoryError: Java heap space
This is executor out of memory. It means one task was handed more data than its share of the executor’s memory could hold.
The instinct is to give the cluster more memory. That works, and it is usually the most expensive fix on the list. This article covers what to check first.
First: is it the executor or the driver?
These are different failures with different causes and different fixes, and mixing them up sends people down the wrong path for hours.
Executor OOM
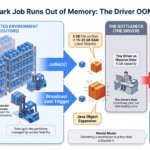
Driver OOM
What ran out
Memory on a worker machine
Memory on the driver
Usual cause
A partition too big for one task
collect(), a large broadcast, huge metadata
What you see
Task failed 4 times, stage failed
The whole application dies
Which tab
Stages → the failing stage
Often no stage at all
Fix direction
Smaller partitions, more memory per task
Stop pulling data to the driver
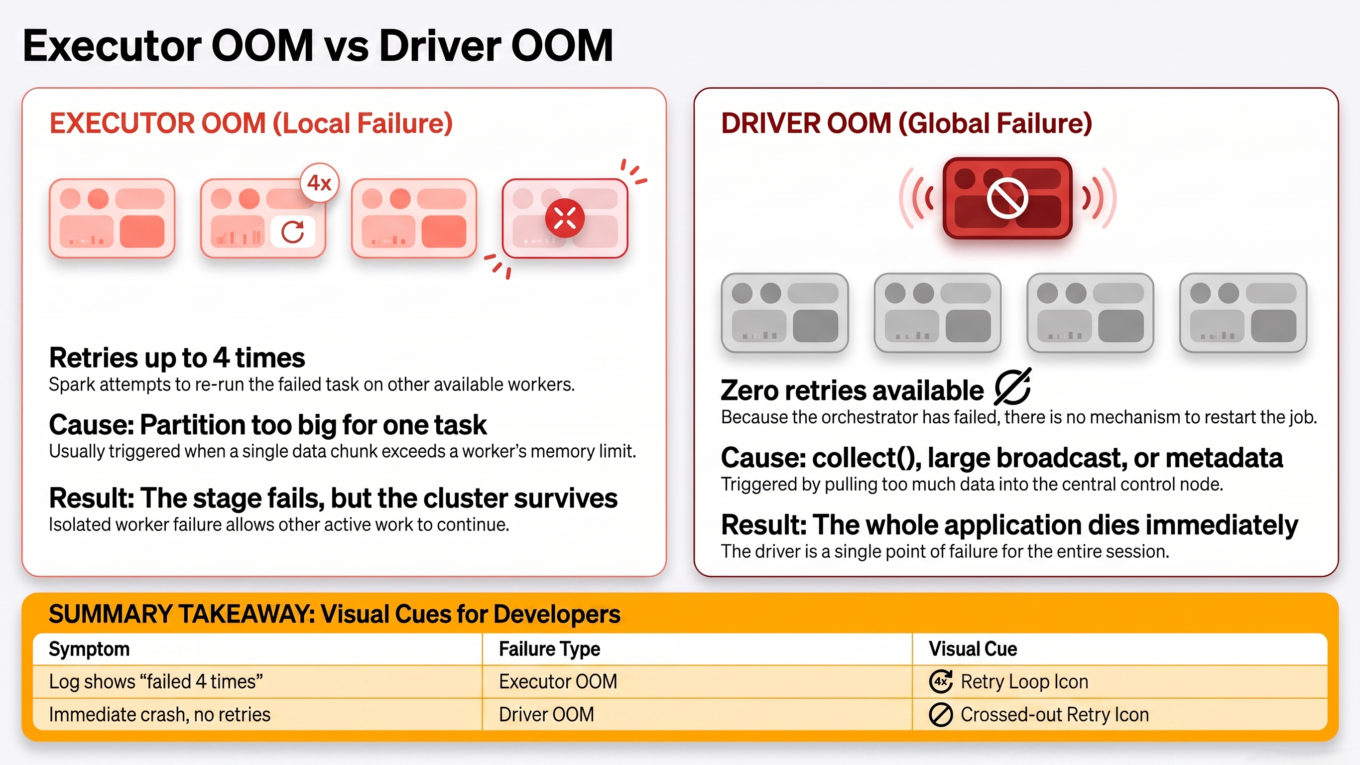
The quickest tell: executor OOM produces task retries. Spark tries the task again on another executor, up to four times, before giving up. If your log says “failed 4 times”, it is an executor problem.
Driver OOM has no retries — the coordinator is gone, so the application ends immediately. If that is what you are seeing, read Spark Driver OOM instead; the rest of this article will not help you.
Executor OOM retries the task. Driver OOM ends the application. The retries are the tell.
The two different executor errors
This is the distinction most guides skip, and getting it wrong means tuning the wrong setting.
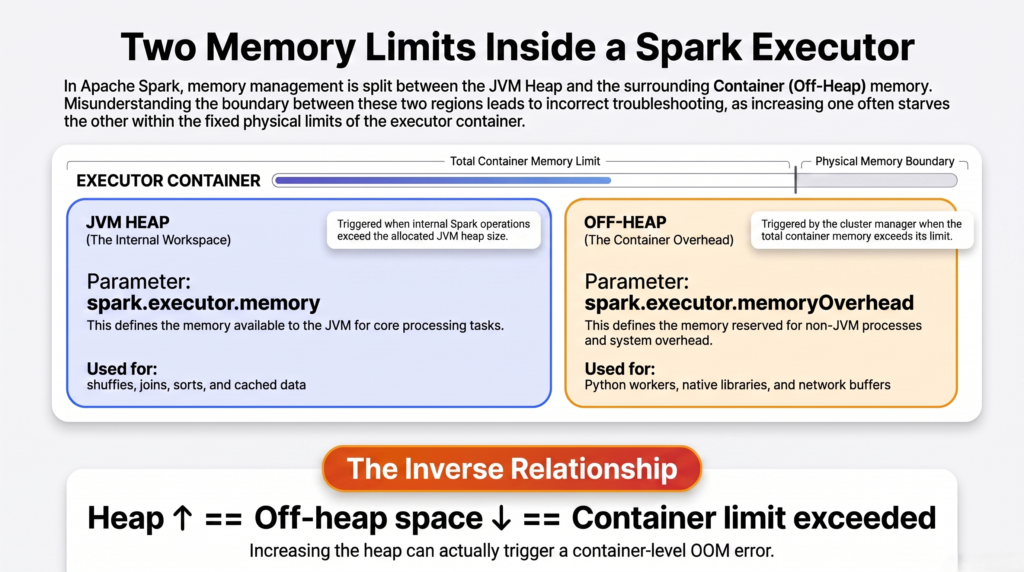
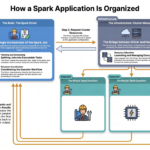
An executor is a JVM, and that JVM runs inside a container. There are two separate memory limits, and each has its own error message.
The JVM heap is full. Your data did not fit in the memory Spark manages. This is the common case, and it is caused by partitions that are too large.
“GC overhead limit exceeded” is the same problem at an earlier stage — the JVM is spending nearly all its time garbage collecting and reclaiming almost nothing. Treat it identically.
Error 2: container killed
ExecutorLostFailure (executor 5 exited caused by one of the running tasks)Reason: Container killed by YARNfor exceeding memory limits.10.4GB of 10GB physical memory used.Consider boosting spark.yarn.executor.memoryOverhead
Completely different. The JVM heap was fine — the container exceeded its total limit and the resource manager killed it.
A container holds more than the heap. It also holds off-heap memory: Python worker processes, native libraries, network buffers, and JVM overhead. None of that is governed by spark.executor.memory.
Error
What filled up
What to change
Java heap space
The JVM heap
Smaller partitions, or spark.executor.memory
GC overhead limit exceeded
The JVM heap (nearly)
Same as above
Container killed... exceeding memory limits
Off-heap memory
spark.executor.memoryOverhead
Raising spark.executor.memory when you are being killed for overhead can actually make things worse — a bigger heap inside the same container leaves less room for the off-heap part that was the real problem.
PySpark users hit the container error more often, because Python worker processes live entirely off-heap. A `@pandas_udf` holding a large Arrow batch consumes container memory that Spark’s own settings do not cover — see PySpark Data Serialization.
Two limits, two errors. The heap is what Spark manages; the container also holds Python workers and native memory.
What actually causes it
Almost every case comes down to the same sentence: a task received more data than the memory available to it. The causes are just different ways of arriving there.
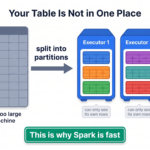
Skew. One key dominates, so one partition is enormous while the rest are small. The most common cause by far.
Too few partitions. The default of 200 shuffle partitions means each one is huge on a large dataset.
Too many cores per executor. Memory is shared across concurrent tasks, so more cores means less memory each.
An oversized broadcast. Every executor holds a full copy, and the estimate is based on compressed file size.
Caching. Cached DataFrames occupy the same pool your shuffles need.
Exploding data.explode(), cross joins and window functions can turn a small input into an enormous intermediate result.
Python workers. Off-heap memory that spark.executor.memory does not cover.
Diagnosing it in the Spark UI
The single most useful thing you can do is find out whether one task failed or many did. That one question splits the fixes in half.
Open the Spark UI and go to the Stages tab.
Click into the failed stage.
Open Summary Metrics and read across the percentile columns.
Shuffle read of 0 B at the median against 1.7 GiB at the max — one task got everything. That task is the one that ran out of memory.
What you see
Diagnosis
Where to go
Max shuffle read far above the Median
Skew — one partition is enormous
Fix the distribution, not the memory
All percentiles similar and large
Partitions are simply too big everywhere
More partitions, or more memory per task
Spill non-zero before the failure
You were already short on memory
Spill is the warning that precedes OOM
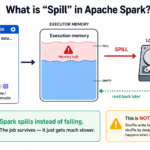
That last row is worth knowing. Spill almost always comes before an OOM. Spark spills to disk when memory runs short, and only fails when spilling is no longer enough. So if a stage was spilling last week and OOMs this week, nothing mysterious happened — the data grew. Detail in Spark Spill to Disk.
The Executors tab is worth a look too. If one executor died repeatedly while others were fine, that points at skew. If executors failed all over the cluster, the sizing is wrong everywhere.
How to fix it, in order
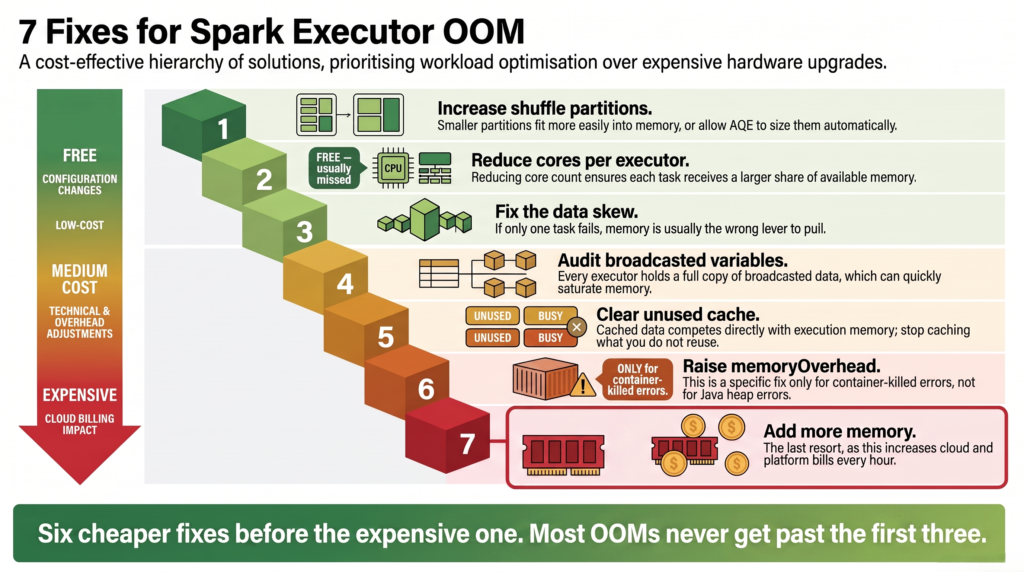
Work down this list. Adding memory is last for a reason — it is the only item you pay for every hour the cluster runs.
1. Increase the number of partitions
More partitions means each one is smaller, so each task’s working set fits. This is the first thing to try and it fixes most cases.
spark.conf.set("spark.sql.shuffle.partitions", "800")# Better: let AQE size them at runtime (Spark 3.x, on by default)spark.conf.get("spark.sql.adaptive.enabled")
2. Reduce cores per executor
The fix nobody reaches for, and it costs nothing.
An executor’s memory is shared by every task running on it at once, and that number equals the core count:
Executor memory
Cores
Memory per task
64 GB
16
~4 GB
64 GB
8
~8 GB
64 GB
4
~16 GB
You trade parallelism for headroom, on hardware you are already paying for.
3. Fix the skew
If Summary Metrics shows one task getting everything, memory tuning is the wrong lever. You would be sizing the entire cluster around a single oversized partition. Salting, broadcasting the small side, or letting AQE split the partition are the real fixes — see Fix Spark Data Skew in Joins.
4. Check what you are broadcasting
A broadcast table is held in full by every executor, and Spark decides based on compressed file size. An 8 MB Parquet file can be 70 MB in memory. If the OOM started after someone added a broadcast() hint, that is your answer — see Broadcast Join vs Bucketing.
# Temporarily disable auto-broadcast to test the theoryspark.conf.set("spark.sql.autoBroadcastJoinThreshold", "-1")
5. Stop caching what you do not reuse
Cached data and shuffle memory share one pool. A large .cache() can cause the very failure it was meant to prevent.
df.unpersist()
6. Raise memory overhead — but only for container-killed errors
If the error says “Container killed” rather than “Java heap space”, this is the setting that matters:
The default is roughly 10% of executor memory with a 384 MB floor, which is often not enough for PySpark workloads where Python workers need real space.
7. Only then, add memory
Moving to a memory-optimised instance roughly doubles RAM per core. It works — and you pay for it every hour, on both the cloud bill and the platform bill. Which family to choose is covered in Azure Databricks Instance Types Explained, and the cluster-type decision that sits alongside it in Databricks Clusters Explained.
Six free fixes before the expensive one. Most OOMs never get past the first three.
Quick reference
Question
Answer
Executor or driver?
Task retried 4 times = executor. Application died outright = driver
Java heap space
The JVM heap filled. Smaller partitions, or more executor memory
Executor OOM means one task got more data than its share of memory. It retries four times, then fails the stage.
Driver OOM is a different problem with different fixes — the giveaway is that it has no retries.
Java heap space and Container killed are not the same error. The first is the JVM heap; the second is off-heap memory, and it needs memoryOverhead, not executor.memory.
Read the Summary Metrics percentiles. One task failing means skew; every task failing means partitions are too big everywhere.
Spill is the warning that comes before OOM. A stage that spills today fails tomorrow when the data grows.
Try more partitions, then fewer cores per executor, then fix skew. Adding memory is the last resort because you pay for it hourly.
Executor OOM is the most severe of the three problems that come out of a shuffle, after skew and spill. For how they connect, see Spark Shuffle Explained.
Frequently Asked Questions
What causes java.lang.OutOfMemoryError in Spark?
A task was given more data than the memory available to it. The usual causes are data skew putting one enormous partition on one task, too few shuffle partitions making every partition large, too many cores per executor dividing memory too thinly, an oversized broadcast table, or cached data competing for the same pool.
What is the difference between executor OOM and driver OOM?
Executor OOM happens on a worker machine when a task cannot fit its data in memory. Spark retries the task up to four times before failing the stage. Driver OOM happens on the coordinating machine, usually from collect() or assembling a large broadcast, and kills the whole application immediately with no retries. The presence of retries is the quickest way to tell them apart.
What does “Container killed by YARN for exceeding memory limits” mean?
The JVM heap was fine, but the container as a whole exceeded its limit and was killed. Containers also hold off-heap memory — Python worker processes, native libraries and network buffers — which spark.executor.memory does not govern. The fix is spark.executor.memoryOverhead. Raising executor memory instead can make it worse, since a larger heap leaves less room in the same container.
How do I fix GC overhead limit exceeded in Spark?
Treat it exactly like a heap OOM. It means the JVM is spending nearly all its time garbage collecting while reclaiming almost nothing — the same shortage caught slightly earlier. Increase the number of partitions so each task holds less, reduce cores per executor so each task gets more memory, and check for skew before adding hardware.
Should I just increase spark.executor.memory?
It usually works, and it is the most expensive option — you pay for it every hour the cluster runs. Try more partitions and fewer cores per executor first, both of which are free. And if the error was a killed container rather than a heap OOM, raising executor memory is the wrong setting entirely.
Why does reducing cores per executor help with OOM?
Because an executor’s memory is shared by all the tasks running on it simultaneously, and that number equals the core count. An executor with 64 GB and 16 cores gives each task about 4 GB; the same executor with 8 cores gives each task about 8 GB. You lose some parallelism and gain headroom, without changing hardware.
Can data skew cause out of memory errors?
Yes, and it is the most common cause. When one key dominates, all its rows land in a single partition processed by a single task on a single executor. That task is the one that runs out of memory. Check Summary Metrics — if the Max shuffle read is far above the Median, size the data distribution rather than the cluster.
Why does my PySpark job hit memory limits more than Scala?
Because Python UDFs run in separate worker processes whose memory sits outside the JVM heap. That memory counts toward the container limit but is not covered by spark.executor.memory, so PySpark jobs hit “Container killed” errors more often. Lowering the Arrow batch size or raising spark.executor.memoryOverhead usually helps more than adding executor memory.