Spark Spill to Disk: Why It Happens and How to Fix It
Spill means Spark ran out of memory in the middle of a task and dumped its working data to disk. Your job does not fail — it just gets slower, with nothing in the logs to explain why.
Spill is the most under-diagnosed problem in Spark, because it never announces itself.
Nothing fails. Nothing errors. There is no message in the logs. Your job simply takes three hours instead of forty minutes, and nobody can say why.
This article covers what spill actually is, the two spill numbers in the Spark UI and why they differ, how to tell spill apart from skew, and the fixes in the order you should try them.
What is spill?
Spark does its work in memory. A task loads its partition, builds whatever it needs — a sort buffer, a hash map for an aggregation, a join structure — and processes it.
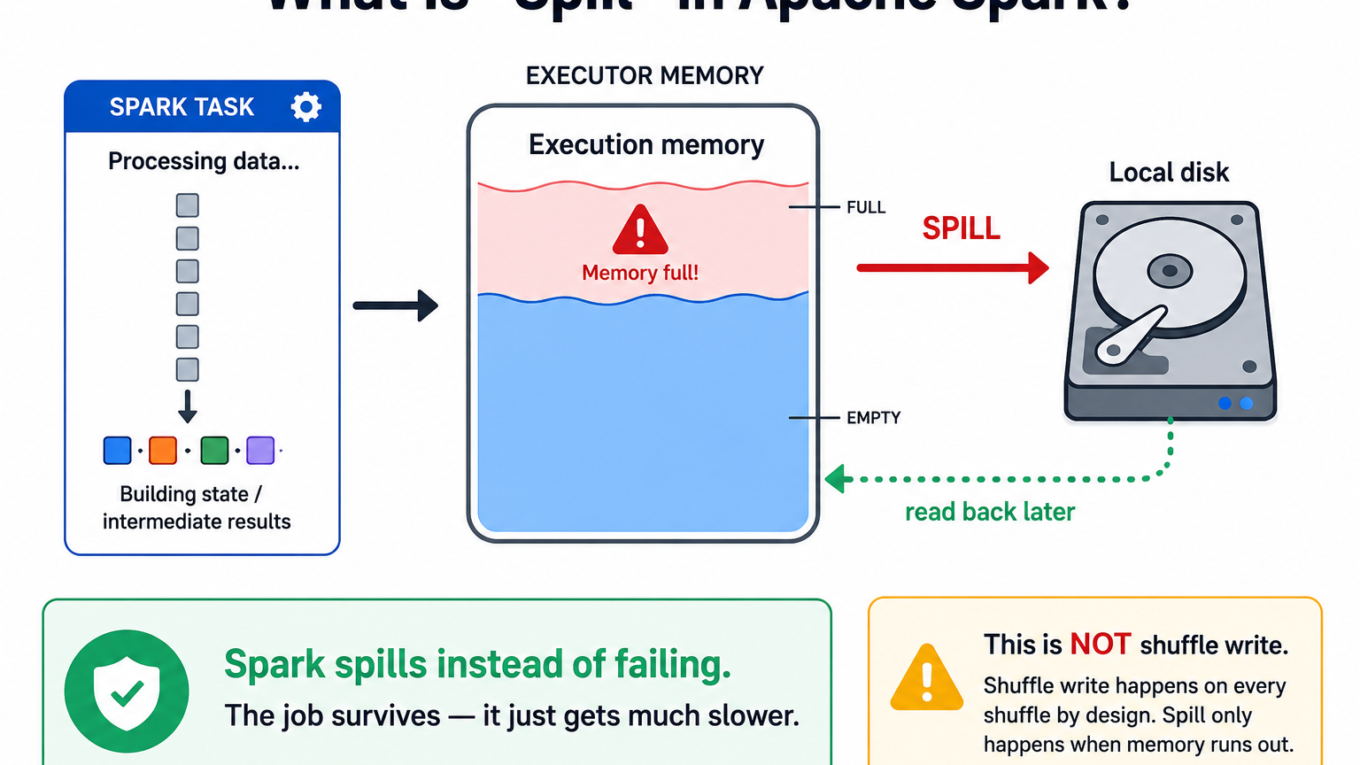
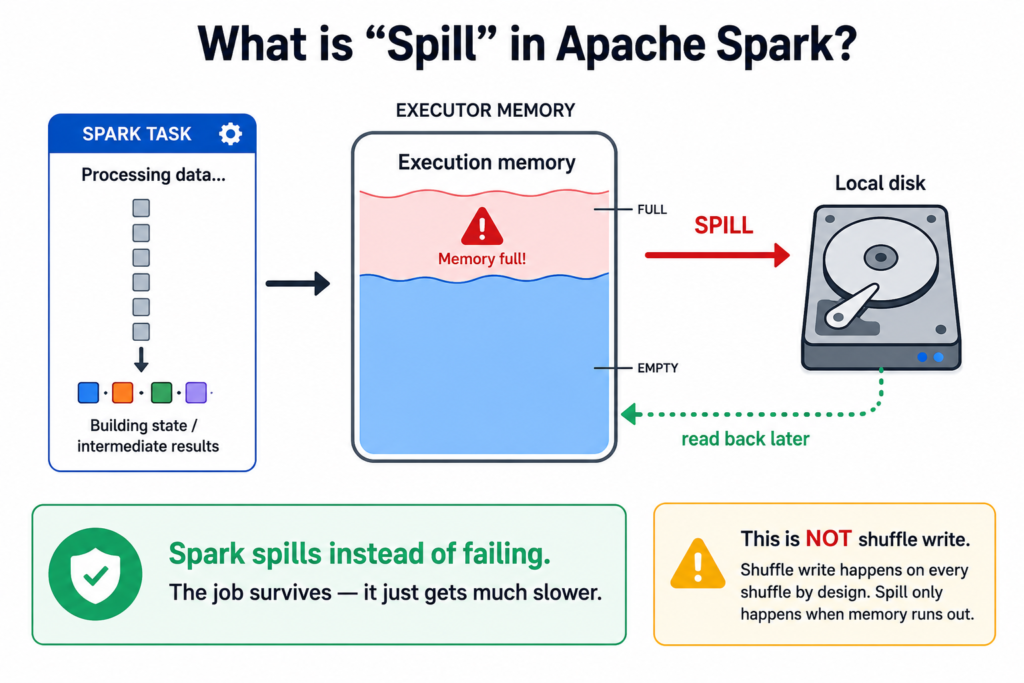
Spill is what happens when that working data does not fit in memory.
Rather than crash, Spark writes the overflow to local disk, carries on, and reads it back later when it needs it. It is a safety valve. The job survives — it just gets dramatically slower.
Think of it like working at a desk that is too small. You keep the papers you need in front of you, and when the desk fills up you start stacking the rest on the floor. Nothing is lost. But every time you need something from the floor you have to bend down, find it, and put something else away to make room.
Spill is Spark’s safety valve: when memory fills up, the overflow goes to disk instead of crashing the job.
One thing to be clear about straight away, because it causes a lot of wasted debugging. Spill is not the same as shuffle write. Shuffle write is Spark deliberately writing shuffle files to local disk, and it happens on every single shuffle by design. Spill is an emergency measure taken because memory ran out. Shuffle write is normal; spill is a symptom. See Spark Shuffle Explained for how the two fit together.
The two spill numbers, and why they differ
The Spark UI shows two spill metrics, and almost everyone assumes they are two different things happening.
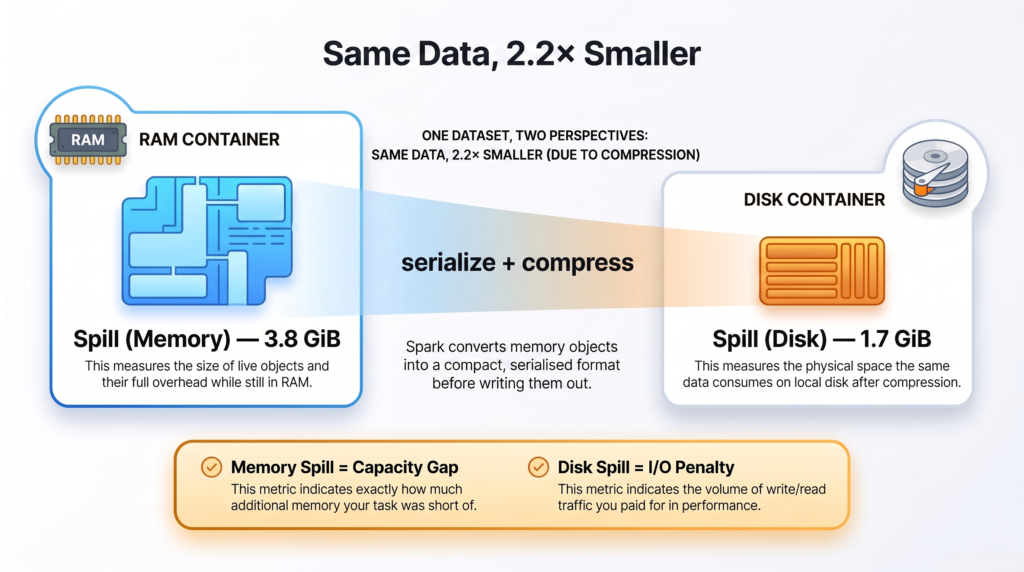
Spill (Memory) — how much space the data took up in memory, before it was spilled.
Spill (Disk) — how much space that same data took up on disk, after being written.
They are the same data, measured twice. Not two separate problems.
Spill (Memory) is always the larger number, because data in memory is stored as live objects with all their overhead. On the way to disk Spark serializes and compresses it, so it shrinks — typically to somewhere between a third and a half of its in-memory size.
Here are real numbers from a spilling stage:
Metric
75th percentile
Max
Spill (Memory)
544 MiB
3.8 GiB
Spill (Disk)
234.6 MiB
1.7 GiB
Ratio
2.3×
2.2×
The ratio holds steady at roughly 2.2× because that is simply the compression Spark achieved on the way out.
Which number should you care about? Spill (Memory), because it tells you how much memory you were actually short of. Spill (Disk) tells you how much I/O you paid for.
Spill Memory vs Spill Disk Explained
Which memory ran out?
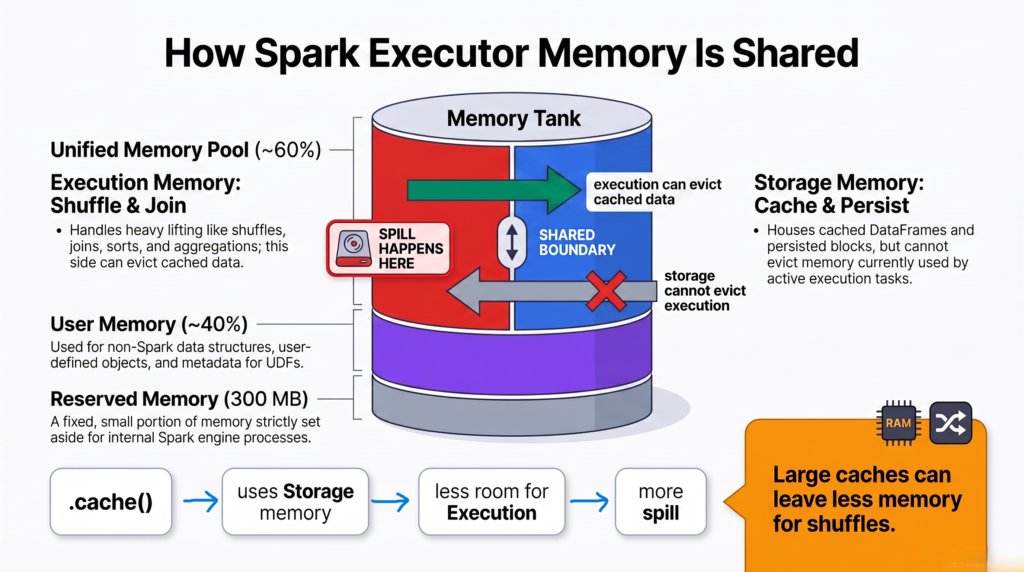
An executor’s memory is not one big pool. It is divided, and only one part of it causes spill.
Region
Roughly
Used for
Execution memory
Share of 60%
Shuffles, joins, sorts, aggregations — this is what spills
Storage memory
Share of 60%
Cached and persisted DataFrames
User memory
About 40%
Your own objects, UDF data structures
Reserved
300 MB
Spark’s own internals
Execution and storage share a single pool, controlled by spark.memory.fraction (default 0.6). They borrow from each other as needed — and crucially, execution can evict cached data, but cached data cannot evict execution.
That matters more than it sounds. Calling .cache() on a large DataFrame takes memory that your shuffles wanted. Spark will push back when it needs to, but up to spark.memory.storageFraction (default 0.5) your cached data is protected and cannot be evicted at all. Caching a big DataFrame is one of the more common ways people accidentally cause the spill they are trying to avoid.
Execution memory is what spills — and cached data competes with it for the same pool.
What causes spill
Spill happens during operations that need to hold a lot of data at once:
Shuffles — the biggest source. A partition arrives that is larger than the memory available to process it.
Sorting — orderBy and sort must hold the data being sorted.
Sort-merge joins — both sides get sorted before merging.
Aggregations on high-cardinality keys — the hash map holding the groups grows with the number of distinct keys.
Window functions — a window partition often has to be materialised in full.
Explode and cross joins — a small input becomes an enormous intermediate result.
Underneath all six sits the same root cause: the partition is too big for the memory available to the task processing it. Every fix below is some way of changing one side of that sentence.
Detecting spill in the Spark UI
Open the Spark UI and go to the Stages tab.
Click into the slowest stage.
Scroll to Summary Metrics and look at the Spill (Memory) and Spill (Disk) rows.
If both rows are 0.0 B all the way across, there is no spill and this is not your problem. Any non-zero value means it happened.
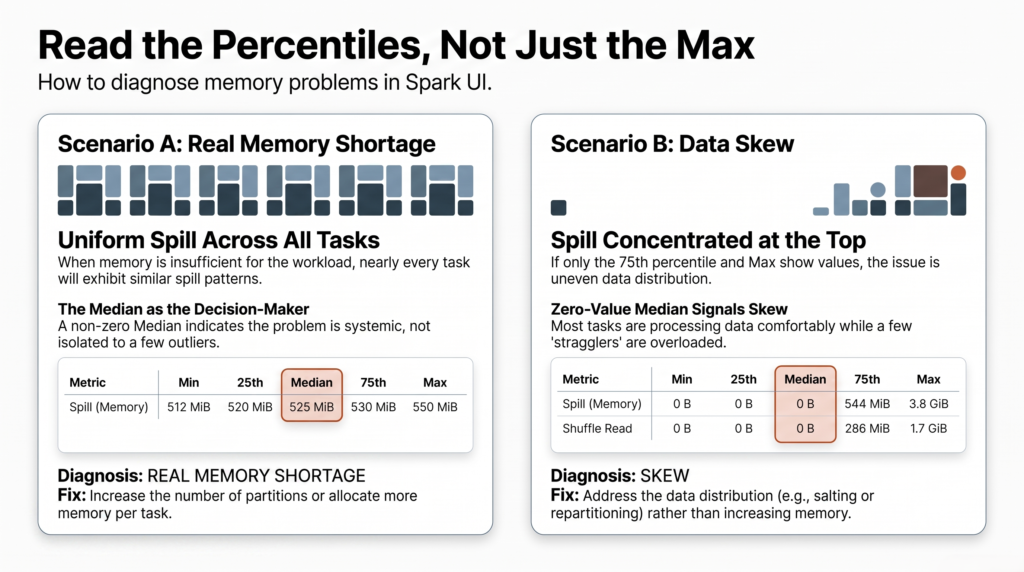
Spill columns at 0 B through the median, then 544 MiB at the 75th percentile and 3.8 GiB at the max — only some tasks are spilling.
Read across the percentile columns, not just the Max. Where the spill starts tells you what kind of problem you have.
Is it spill, or is it skew?
This is the distinction that decides your fix, and it is easy to read once you know what to look for.
What the percentiles show
Diagnosis
Fix
Spill at the Median as well as the Max — most tasks spilling
Genuine memory shortage
More partitions, or more memory per task
Spill zero until the 75th, then large at Max — only a few tasks spilling
Skew
Fix the skew, not the memory
The screenshot above is the second case. Spill is 0.0 B at the Min, 25th and Median — most tasks never spilled at all. It only appears at the 75th percentile and jumps to 3.8 GiB at the Max.
Look at the Shuffle Read row on the same screenshot and it confirms the story: 0.0 B at the median, 1.7 GiB at the max. A handful of tasks received enormous partitions, and those are exactly the tasks that spilled.
That is not a memory problem. That is skew causing spill. Adding memory to the cluster would let those few tasks squeeze through without spilling, but you would be paying for a much larger cluster to work around uneven data. The real fix is in Fix Spark Data Skew in Joins.
Where the spill starts is the diagnosis. Everywhere means memory. Only at the top means skew.
How to fix spill, in order
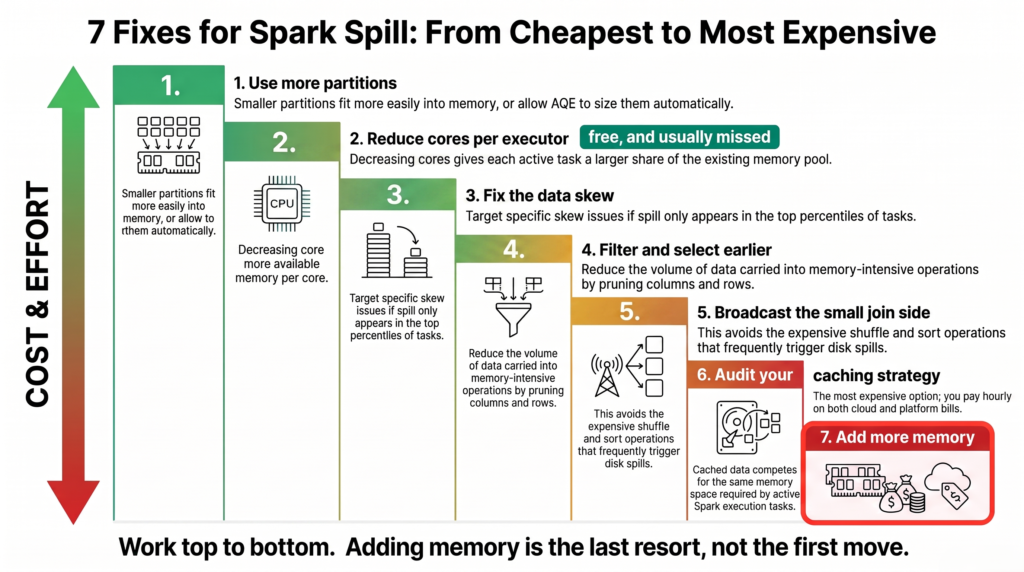
Work down this list. The cheap fixes are at the top for a reason.
1. Use more partitions
The first thing to try, and usually the answer. More partitions means each one is smaller, so each task’s working set fits in memory.
# Default is 200 regardless of how much data you havespark.conf.set("spark.sql.shuffle.partitions", "800")
Better still, let Adaptive Query Execution size them at runtime. On Spark 3.x it is on by default and will generally do a better job than a fixed number.
spark.conf.get("spark.sql.adaptive.enabled")
2. Give each task more memory — by reducing cores
This is the fix people almost never think of, and it costs nothing.
An executor’s memory is shared by all the tasks running on it at once, and the number of concurrent tasks equals the number of cores. So an executor with 64 GB and 16 cores gives each task roughly 4 GB. The same 64 GB with 8 cores gives each task 8 GB — double, without adding a single machine.
Executor memory
Cores
Memory per task
64 GB
16
~4 GB
64 GB
8
~8 GB
64 GB
4
~16 GB
You trade parallelism for headroom. If spill is bad enough, fewer tasks running comfortably beats more tasks all thrashing to disk.
3. Fix the skew instead
If spill only shows in the top percentiles, stop tuning memory. You have a skew problem wearing a memory problem’s clothes, and no amount of RAM makes uneven data even.
4. Carry less data into the operation
Filter and select before the shuffle, not after. Every row and every column you drop early is one that never has to fit in memory later. Spark pushes filters down automatically where it can, but it cannot push one through a UDF.
5. Broadcast the small side of a join
A sort-merge join sorts both sides, and sorting is one of the biggest spill sources there is. If one table is small enough to fit in each executor’s memory, broadcasting it removes the shuffle and the sort together.
6. Check what you are caching
Cached DataFrames sit in the same memory pool your shuffles need. If you called .cache() on something large and then hit spill, try removing the cache and measuring again — sometimes the cache is causing the very problem it was meant to solve.
df.unpersist()
7. Only then, add memory
Moving to a memory-optimised instance type roughly doubles RAM per core. It works, and it is also the most expensive item on this list — you pay for it every hour the cluster runs, on both the cloud bill and the platform bill.
Real memory shortage. Add partitions or memory per task
Spill only at the Max?
Skew. Fix the data distribution instead
First fix to try
More partitions, or let AQE size them
Free fix people miss
Fewer cores per executor — each task gets more memory
Summary
Spill is Spark writing working data to disk because it did not fit in memory. The job survives but slows down badly, and nothing appears in the logs.
It is not shuffle write. Shuffle write happens on every shuffle by design; spill is an emergency measure.
Spill (Memory) and Spill (Disk) are the same data measured twice — the disk number is smaller because the data is compressed on the way out.
Execution memory is what spills, and cached DataFrames compete with it for the same pool.
Read the percentiles, not just the Max. Spill everywhere means a memory shortage; spill only in the top percentiles means skew.
Try more partitions first, then fewer cores per executor. Adding memory is the last resort because you pay for it every hour.
Spill is one of three problems that come out of the shuffle, alongside skew and out of memory errors. For how they relate, see Spark Shuffle Explained.
Frequently Asked Questions
What is spill in Spark?
Spill is Spark writing data to local disk because it did not fit in the memory available to a task. It happens during shuffles, sorts, joins and aggregations when the working set exceeds execution memory. Spark spills instead of failing, so the job completes — but disk is far slower than memory, so performance degrades sharply with no error to explain it.
What is the difference between Spill (Memory) and Spill (Disk)?
They are the same data measured at two points. Spill (Memory) is how much space it occupied in memory before spilling; Spill (Disk) is how much it occupied on disk afterwards. The disk figure is smaller because Spark serializes and compresses on the way out — typically two to three times smaller. Use the memory figure to judge how much memory you were short of.
Is spill the same as shuffle write?
No, and confusing them wastes a lot of debugging time. Shuffle write is Spark deliberately writing shuffle files to local disk, which happens on every shuffle by design and is not a problem. Spill is Spark running out of memory while processing and dumping working data to disk as an emergency measure. Shuffle write is normal; spill is a symptom.
How do I know if spill is caused by skew?
Read the percentile columns in Summary Metrics rather than just the Max. If spill appears at the Median as well, most tasks are spilling and you have a genuine memory shortage. If spill is zero through the Median and only appears at the 75th percentile and Max, only a few oversized partitions are spilling — that is skew, and adding memory only papers over it.
How do I stop Spark spilling to disk?
Increase the number of shuffle partitions so each one is smaller, or let Adaptive Query Execution size them at runtime. If that is not enough, reduce cores per executor so each task gets a larger share of memory. Filter and select earlier, broadcast small join sides, and check whether a cached DataFrame is competing for the same memory. Adding memory should be the last step.
Why does reducing cores per executor help with spill?
Because an executor’s memory is shared by all the tasks running on it simultaneously, and that number equals the core count. An executor with 64 GB and 16 cores gives each task about 4 GB; the same executor with 8 cores gives each task about 8 GB. You trade some parallelism for headroom, and it costs nothing.
Does caching cause spill?
It can. Cached DataFrames live in storage memory, which shares a single pool with the execution memory used by shuffles and sorts. Execution can evict cached data, but a protected portion set by spark.memory.storageFraction cannot be evicted at all. Caching a large DataFrame can therefore cause the spill it was meant to prevent — try unpersisting it and measuring again.
Is spill always bad?
Not always. A small amount of spill on an occasional stage is usually not worth engineering around, and spilling is far better than the job failing with an out of memory error. It becomes worth fixing when it is large, repeated across many tasks, or sitting on your longest-running stage — that is when the disk round trips start dominating the runtime.