Two analysts at the same company pull “last month’s revenue.” They get two different numbers. Why? Because both reached into the same messy pile of raw data and each cleaned it their own way — one dropped cancelled orders, the other didn’t. Nobody trusts either number, and the meeting turns into an argument about the data instead of a decision.
That mess is exactly what Medallion architecture is designed to end. It’s one of the most useful ideas in the modern lakehouse, and — despite the fancy name — it’s genuinely simple. Let’s build it up with a real pipeline you can picture.
The one-sentence idea
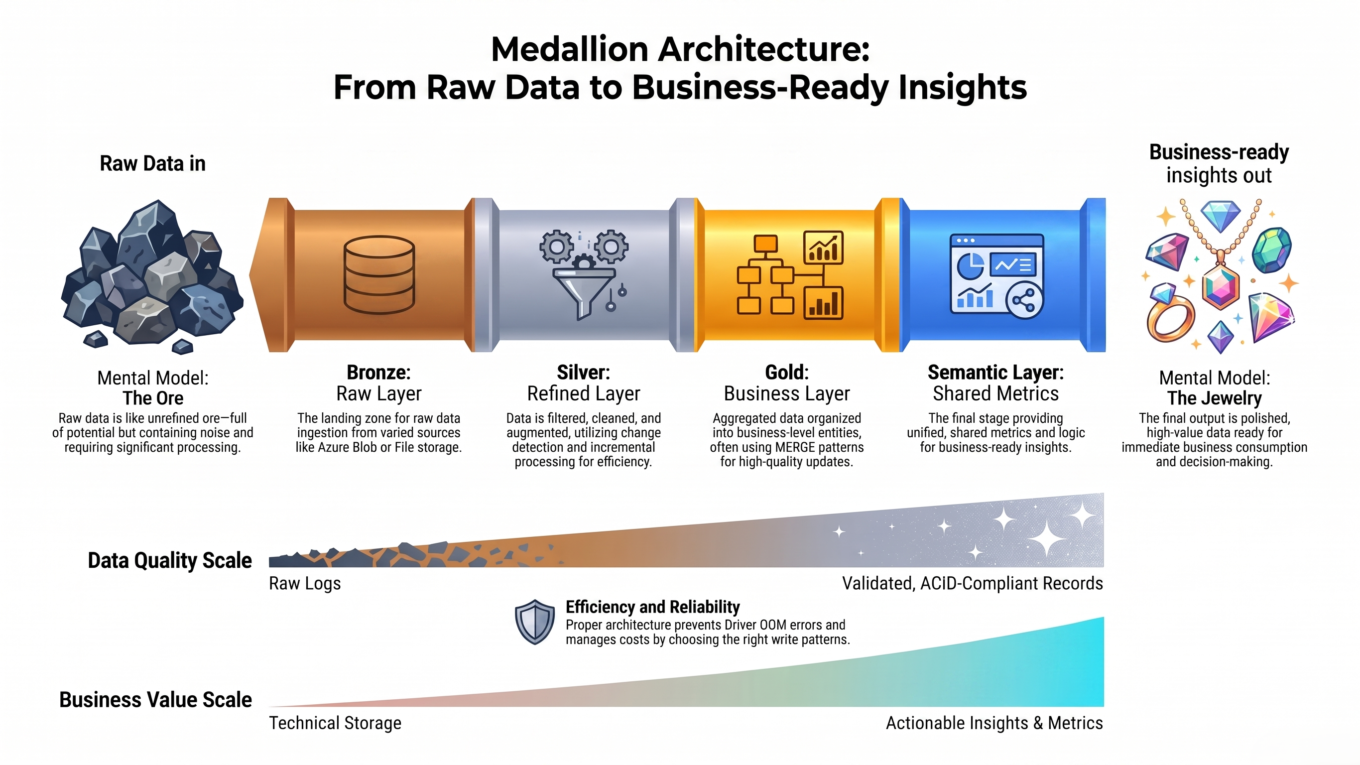
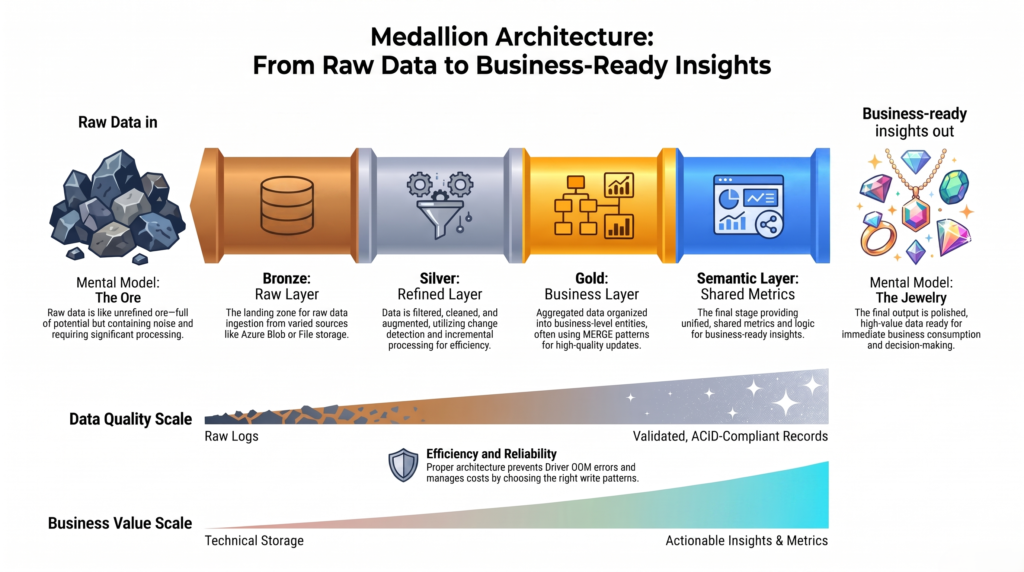
Medallion architecture organizes your data into three layers — Bronze, Silver, and Gold — where the data gets cleaner and more useful at each step.
The names come straight from medals: bronze is the starting tier, silver is better, gold is best. Data flows in one direction — Bronze → Silver → Gold — getting refined as it goes, like a water treatment plant turning muddy river water into bottled drinking water in stages. Raw goes in one end; trustworthy, business-ready data comes out the other.
We’ll follow one real example the whole way: an online grocery company processing its order data.
🥉 Bronze: raw data, exactly as it arrived
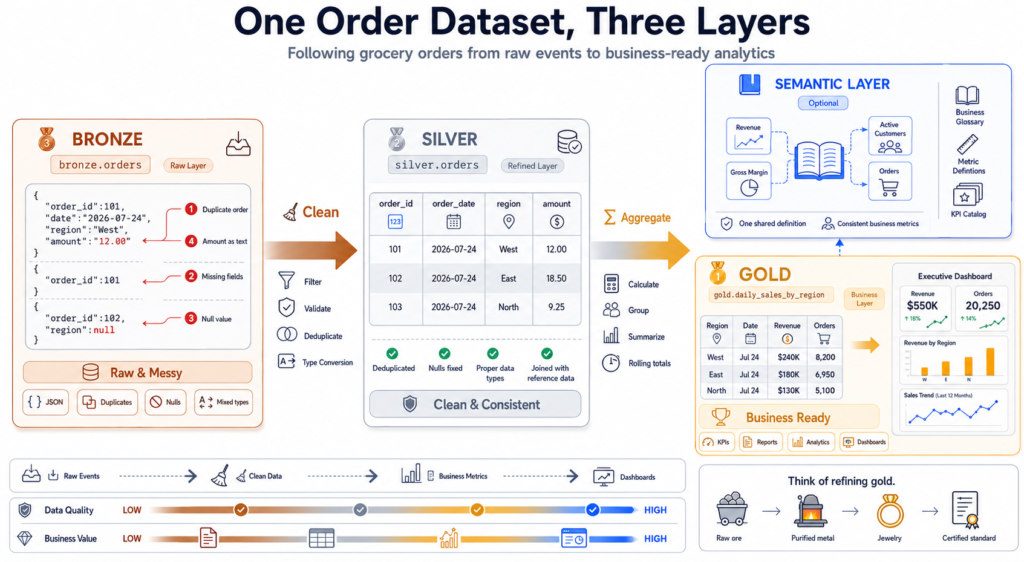
The Bronze layer is the landing zone. You take the raw data from the source and store it as-is — no cleaning, no fixing, warts and all. Duplicates, nulls, weird values: they all come in untouched.
For our grocery company, that’s the raw order events streaming in from the app and website — messy JSON, some duplicated, some missing fields:
# Bronze: land the raw source data, untouched
raw = spark.read.json("/landing/orders")
raw.write.format("delta").mode("append").saveAsTable("bronze.orders")Why keep the mess? Because Bronze is your safety net and history. If a bug is found downstream, or someone wants to rebuild a table a different way next year, you can always go back to the original raw data and reprocess. You never lose anything. Bronze is append-only and rarely touched by analysts directly.
- Holds: raw source data, unchanged
- Purpose: a permanent, replayable record of what actually arrived
- Quality: messy — duplicates, nulls, raw types
🥈 Silver: cleaned, conformed, and joined
The Silver layer is where the data gets cleaned up into something trustworthy. You remove duplicates, drop or fix broken rows, standardize types and formats, and often join related sources together into a coherent picture.
from pyspark.sql.functions import col, to_date

bronze = spark.read.table("bronze.orders")

silver = (bronze
    .dropDuplicates(["order_id"])              # remove repeats
    .filter(col("order_id").isNotNull())       # drop broken rows
    .withColumn("order_date", to_date("order_ts"))   # standardize types
    .withColumn("amount", col("amount").cast("double")))

silver.write.format("delta").mode("overwrite").saveAsTable("silver.orders")Silver is the single, clean version of the truth that everyone in the company can build on. Instead of ten analysts each cleaning the raw data ten different ways (and getting ten different revenue numbers), they all start from the same clean silver.orders. That alone kills the “why don’t our numbers match?” problem from the opening.
- Holds: cleaned, deduplicated, standardized, joined data
- Purpose: one reliable source everyone shares
- Quality: clean and consistent
🥇 Gold: business-ready answers
The Gold layer is the finished product: curated tables shaped for a specific business need — usually aggregated, summarized, and ready to drop straight into a dashboard or ML model. No cleaning happens here; it’s about packaging the clean data into answers.
from pyspark.sql.functions import sum, count

gold = (spark.read.table("silver.orders")
    .groupBy("region", "order_date")
    .agg(sum("amount").alias("revenue"),
         count("*").alias("order_count")))

gold.write.format("delta").mode("overwrite").saveAsTable("gold.daily_sales_by_region")Now the morning dashboard just reads gold.daily_sales_by_region — tiny, fast, and correct. You might have many Gold tables, each purpose-built: one for the sales dashboard, one for a churn model, one for the finance report. They all trace back to the same trustworthy Silver.
- Holds: aggregated, business-specific tables
- Purpose: fast, ready-to-use answers for dashboards, reports, and ML
- Quality: curated and business-ready
The whole pipeline, at a glance
| Layer | Our grocery example | What’s in it | Quality |
|---|---|---|---|
| 🥉 Bronze | bronze.orders | Raw order JSON — duplicates, nulls, as-received | Messy |
| 🥈 Silver | silver.orders | Deduped, typed, joined to customers & products | Clean |
| 🥇 Gold | gold.daily_sales_by_region | Revenue & order counts per region per day | Business-ready |
The optional Semantic layer
Some teams add one more layer on top of Gold: the semantic layer. It’s not another copy of the data — it’s a shared set of business definitions and metrics that sits between Gold and the people asking questions.
Here’s the problem it solves. What exactly is an “active customer”? What counts toward “revenue” — before or after refunds? If every dashboard defines these differently, you’re back to mismatched numbers even with clean data. The semantic layer pins those definitions down once, so every tool and report calculates “revenue” and “active customer” the same way.
- Holds: agreed business metrics and definitions (not raw data)
- Purpose: everyone uses the same meaning for the same term
- Where it lives: in a BI tool’s model, a metrics layer, or Databricks’ metric views
It’s optional — plenty of teams stop at Gold — but it’s the final piece for keeping a whole organization honest about what the numbers mean.
Why this pattern wins
- One source of truth. Everyone builds on the same clean Silver, so numbers finally agree.
- You can always rebuild. Because Bronze keeps the raw history, you can reprocess Silver and Gold any time — after a bug fix, or with new logic.
- Problems are easy to isolate. Wrong number in a dashboard? Check Gold. Clean but wrong? Check Silver. Missing data? Check Bronze. Each layer has one job.
- Work is reusable. Clean the data once in Silver; every Gold table and every team benefits.
Common mistakes to avoid
- Cleaning in Bronze. Don’t. Bronze must stay raw so it can serve as your replayable history.
- Letting analysts query Bronze directly. They’ll each re-clean it and reintroduce the mismatched-numbers problem. Point them at Silver and Gold.
- Doing aggregation in Silver. Keep Silver at the detailed, row-level clean data; summarize in Gold, where different teams need different shapes.
- Over-engineering small projects. For a tiny dataset, three layers can be overkill — use the pattern when you have real scale, multiple consumers, or trust problems.
The takeaway
Medallion architecture is a refinement pipeline in three stages. Bronze keeps the raw data exactly as it arrived, as a replayable safety net. Silver cleans, standardizes, and joins it into one trustworthy source everyone shares. Gold packages that clean data into business-ready tables for dashboards, reports, and ML — and an optional semantic layer locks down what the metrics actually mean. The payoff is the thing every data team craves: numbers that agree, problems that are easy to trace, and the freedom to rebuild anything from the raw source. Start raw, refine in steps, and let each layer do one job well.
Frequently Asked Questions
What is Medallion architecture?
Medallion architecture is a data design pattern that organizes data into three layers of increasing quality: Bronze (raw, as-ingested), Silver (cleaned and joined), and Gold (aggregated, business-ready). Data flows one way through the layers, getting more refined and trustworthy at each step. An optional semantic layer on top standardizes business metric definitions.
What is the difference between Bronze, Silver, and Gold?
Bronze stores raw source data exactly as it arrived, including duplicates and nulls, as a replayable history. Silver holds cleaned, deduplicated, standardized, and joined data — the single source of truth teams share. Gold contains aggregated, business-specific tables shaped for dashboards, reports, and machine learning.
Why keep the raw data in the Bronze layer?
Because it acts as a permanent safety net. If a bug is found downstream or the business needs the data reshaped later, you can go back to the untouched Bronze data and rebuild Silver and Gold from scratch. Cleaning the data in Bronze would throw away that ability.
What is the semantic layer in Medallion architecture?
The semantic layer is an optional layer on top of Gold that stores agreed business definitions and metrics — like exactly what “revenue” or “active customer” means — rather than copies of the data. It ensures every dashboard and tool calculates the same metric the same way, preventing mismatched numbers.
Do I always need all three layers?
Not always. The medallion pattern shines when you have real scale, multiple teams consuming the data, or trust and consistency problems. For very small or simple projects, three layers can be over-engineering — apply the pattern where the benefits of reproducibility and a shared source of truth actually matter.
Is Medallion architecture only for Databricks?
No. The term is closely associated with Databricks and Delta Lake, but the Bronze/Silver/Gold pattern is a general approach that works on any lakehouse or data platform. It’s a way of organizing data by quality, not a product-specific feature.